Overview

The ImmPort Data Model represents evolutionary work within the immunology research community by supporting multiple data standards, ontologies, and interfaces to promote FAIR data sharing. Details develop the data model is captured in the 2012 publication Toward an Ontology-Based Framework for Clinical Research Databases. The Basic Formal Ontology (BFO) and Ontology for Biomedical Investigations (OBI) were used as the foundation for the classes of entities and relationships represented in the model. The model also incorporates clinical data standards from organizations such as the Clinical Data Interchange Standards Consortium (CDISC).

As seen in the below graphic, the logical model format is stored as a Relational Database Model, where tables capture information for a specific feature, such as a subject or biosample, and related tables are linked through foreign keys. Data is first organized primarily into a study table; the study and its attendant protocols are foundational elements of the scientific method to explain what will be studied, and with what approaches. Each study can be linked to multiple human or animal subject participants in a study, as well as relevant results data on each subject. Data collected about study subjects may take many forms and formats, including questionnaire-based data, clinical trial outcomes, lab tests, medications, and/or mechanistic assays.

An interactive graphic of the ImmPort Data Model is available. Click on image to view.
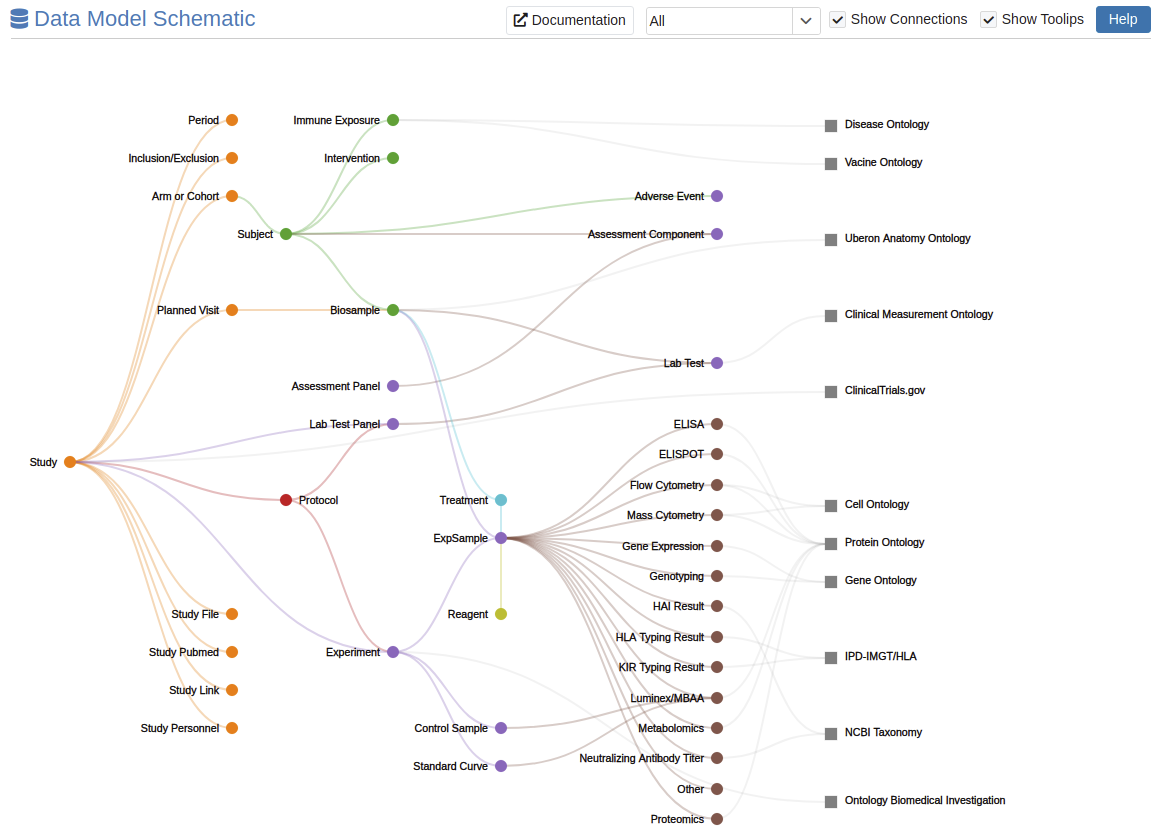
A diagram illustrates the relationships between various components in a study context. The central node is labeled 'Study' and is connected to multiple nodes representing different aspects and elements of a study. To the left, the 'Study' node branches out to: 'Period' (orange), 'Inclusion/Exclusion' (orange), 'Arm or Cohort' (green), 'Subject' (green), 'Planned Visit' (orange), 'Biosample' (green), 'Assessment Panel' (purple), 'Lab Test Panel' (purple), 'Protocol' (red), 'Treatment' (cyan), 'ExpSample' (cyan), 'Reagent' (yellow), 'Experiment' (purple), 'Control Sample' (purple), 'Standard Curve' (purple), 'Study File' (orange), 'Study Pubmed' (orange), 'Study Link' (orange), and 'Study Personnel' (orange). To the right, the 'Study' node is indirectly connected to various ontologies and databases through intermediary nodes. These include: 'Immune Exposure' (green), 'Intervention' (green), 'Adverse Event' (purple), 'Assessment Component' (purple), 'Lab Test' (purple), 'Clinical Measurement Ontology' (grey), 'ClinicalTrials.gov' (grey), 'ELISA' (brown), 'ELISPOT' (brown), 'Flow Cytometry' (brown), 'Mass Cytometry' (brown), 'Gene Expression' (brown), 'Genotyping' (brown), 'HAI Result' (brown), 'HLA Typing Result' (brown), 'KIR Typing Result' (brown), 'Luminex/MBAA' (brown), 'Metabolomics' (brown), 'Neutralizing Antibody Titer' (brown), 'Other' (brown), 'Proteomics' (brown), 'Disease Ontology' (grey), 'Vaccine Ontology' (grey), 'Uberon Anatomy Ontology' (grey), 'Cell Ontology' (grey), 'Protein Ontology' (grey), 'Gene Ontology' (grey), 'IPD-IMGT/HLA' (grey), 'NCBI Taxonomy' (grey), and 'Ontology Biomedical Investigation' (grey). Each node is color-coded based on its category, such as orange for study components, green for subject-related elements, purple for assessment-related elements, red for protocol, cyan for treatment, yellow for reagents, brown for various tests, and grey for ontologies and databases.